What is Price Action Trading Analysis?
What is Price Action Analysis?
My definition of Price Action Analysis: Price action analysis is the analysis of the price movement of a market over time. By learning to read the price action of a market, we can determine a market’s directional bias as well as trade from reoccurring price action patterns or price action setups that reflect changes or continuations in market sentiment.
In simpler terms: Price action analysis is the use of the natural or “raw” price movement of a market to analyze and trade it. This means, you are making all of your trading decisions based purely on the price bars on a “naked” or indicator-free price chart.
All economic variables create price movement which can be easily seen on a market’s price chart. Whether an economic variable is filtered down through a human trader or a computer trader, the movement that it creates in the market will be easily visible on a price chart. Therefore, instead of trying to analyze a million economic variables each day (this is impossible obviously), you can simply learn to trade from price action analysis because this style of trading allows you to easily analyze and make use of all market variables by simply reading and trading off of the price action created by said market variables.
• How do you apply price action analysis to the Forex market?
First, I want to say that price action analysis can be used to trade any financial market, since it simply makes use of the “core” price data of the market. However, my personal favorite market to trade is the Forex market, mainly due to its deep liquidity which makes it easy to enter and exit the market, and also because the Forex market tends to have better trending conditions as well as more volatility which makes for better directional trading and allows price action trading to really shine.
My own personal approach to trading and teaching price action trading is that you can trade effectively from a few time-tested price action setups. There really is no need to try and trade from 25 different price patterns, the Forex market moves in a relatively predictable fashion most of the time, so all we need is a handful of effective price action entry setups to give us a good chance at finding and entering high-probability trades.
The first thing you need to do to apply price action to the Forex market, is to strip your charts of all indicators and get a “clean” price chart with only the price bars in a color you like. I choose simple black and white or blue and red for my colors, but you can pick whichever colors you like (Part 7 will cover an introduction to charting). Here’s an example of my daily chart setup on the EURUSD:
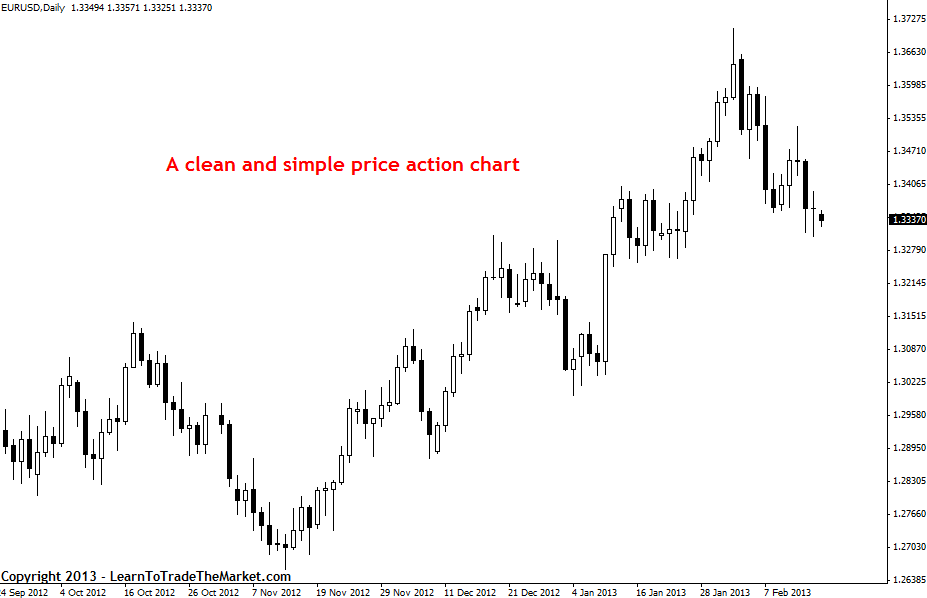
Now, let’s look at an example of a clean and simple price chart next to a price chart covered with some of the most popular indicators that many traders use. I want you to look at these two charts and think about which one seems easier and more logical to trade off of:
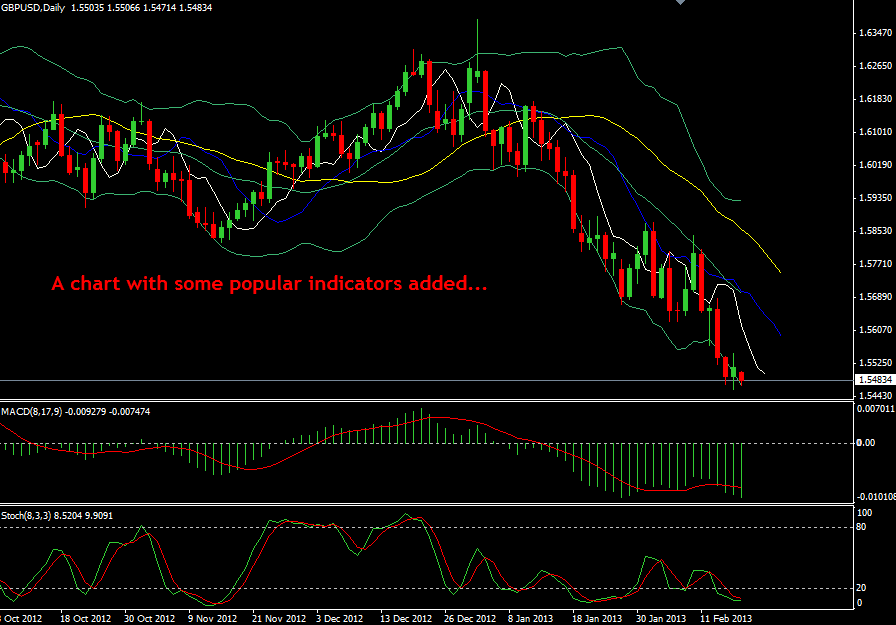
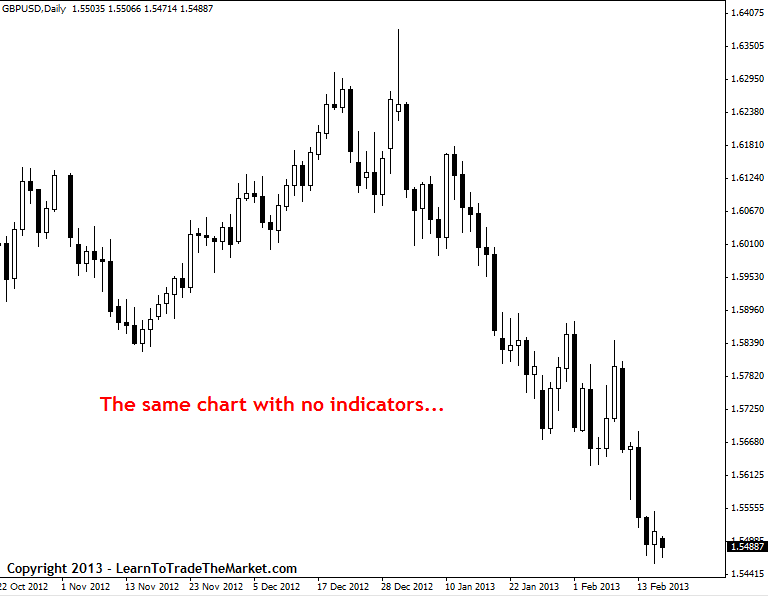
From looking at the two charts above, you will probably agree that it seems a little silly to hide the natural price action of a market with messy and confusing indicators. All indicators are derived from price movement anyways, so if we have a solid method to trade based only on price movement (price action analysis), it only makes sense that we would use that instead of trying to analyze messy secondary data.
• What is a price action trading signal?
Next, let’s discuss how we can use price action analysis to find entries into the Forex market from a raw price chart. As a result of years of trading the markets I have boiled down all I have learned into my own unique method of trading with price action. This method consists of a handful of very specific price action entry triggers that can provide you with a high-probability entry into the market. Essentially, what we are looking for is reoccurring price patterns that tell us something about what the market might do in the near-future.
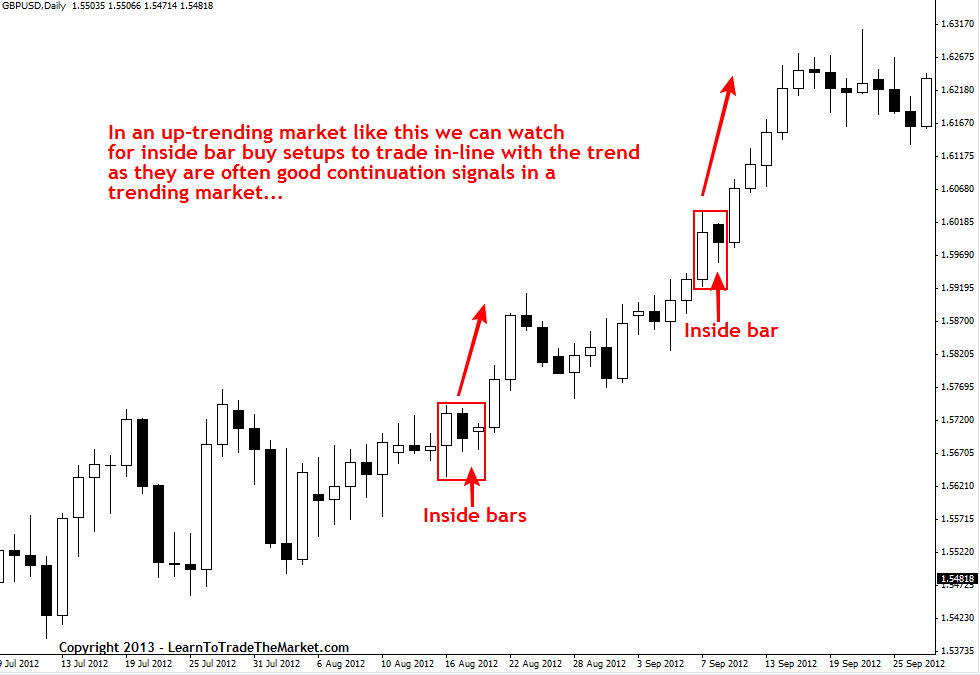
For purposes of brevity and out of respect for my paid members, I won’t give away all of my trading strategies and entry triggers here, but you can learn more about the trading strategies that I teach in my trading course. In the chart below, we are going to look at a particularly good price action signal for trading with trends; the inside bar strategy.
In the example chart below, we can see one price action trading signal that I like to use in trending markets; the inside bar setup:
• How to use price action analysis to determine a market’s trend
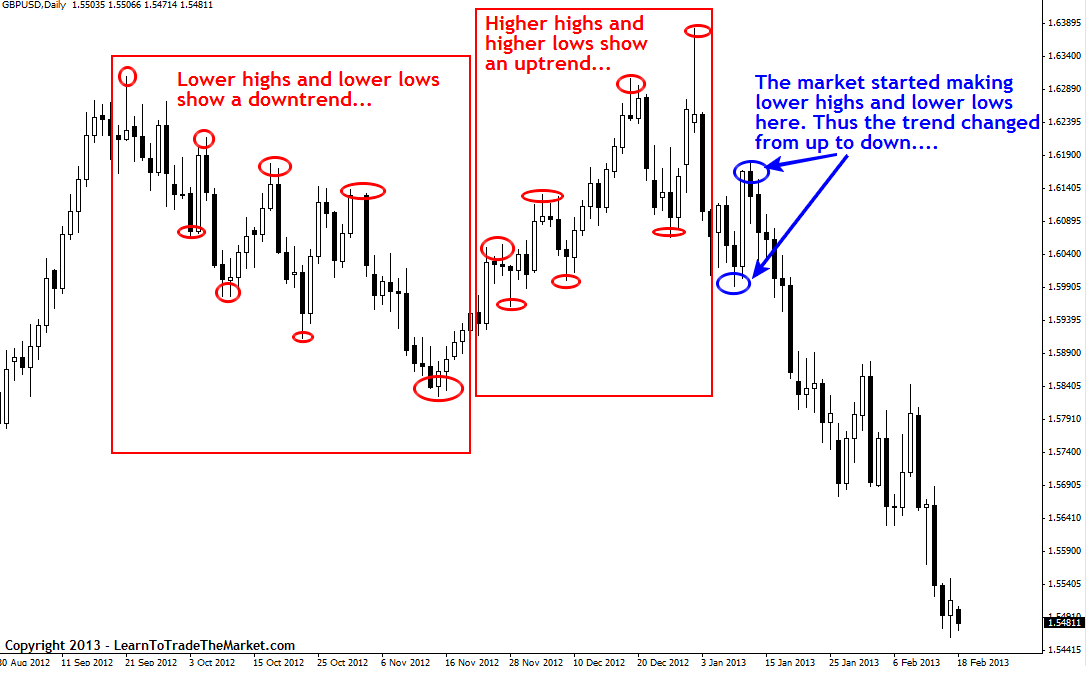
You will probably come across many different indicators designed to tell you what the trend of a market is. However, the most time-tested and trusted way for determining a market’s trend is simply to look at the daily charts and analyze the market’s price action. To identify a downtrend, we look for patterns of lower highs and lower lows, sometimes annotated by “LH and LL”. To identify an uptrend, we look for patterns of higher highs and higher lows, sometimes annotated by “HH and HL”.
In the example chart below, we can see examples of a downtrend, an uptrend and an uptrend changing to a downtrend:
• Where and when should you trade a price action signal?
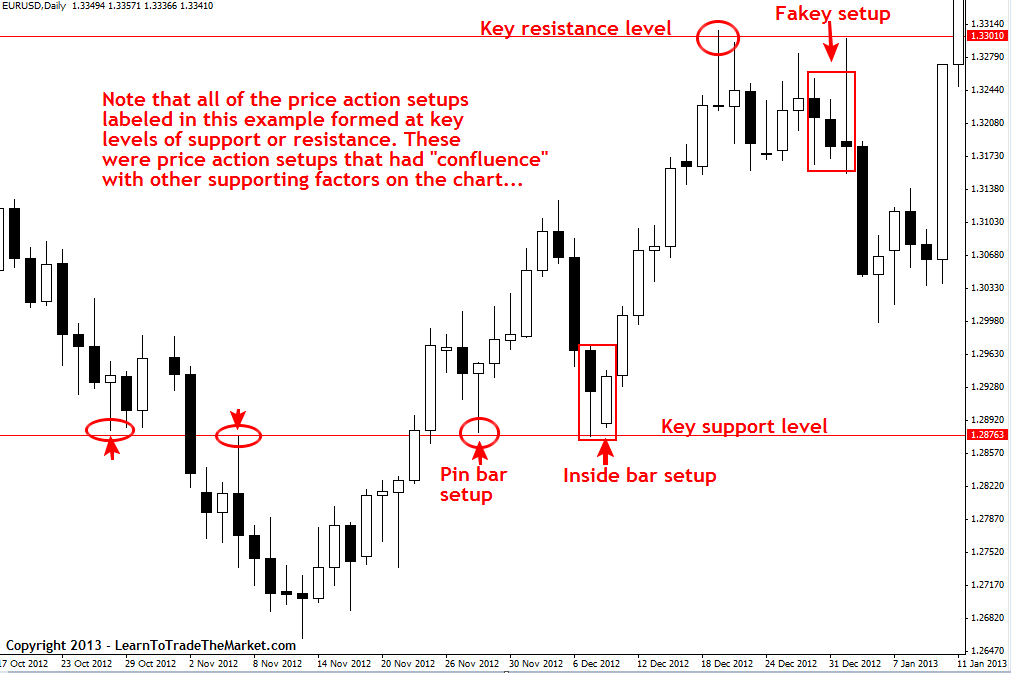
In my trading course I focus heavily on teaching my members how to trade with “confluence”. When I say “trading with confluence” I am basically referring to looking for areas or levels in the market that are clearly significant. Confluence means when things come together or intersect. Thus, when we are looking to “trade with confluence” we are trying to put together an obvious price action signal with a significant level in the market. There are different factors of confluence that we can watch for, but in the chart below I am showing you price action setups that formed at key support and resistance levels in the market; support and resistance are each a factor of confluence. Note, I have shown you two more price action setups in the chart below; the pin bar strategy and the fakey trading signal.
In the example chart below, we are looking how to trade price action setups from confluent levels in the market:
Tags: Price Action, Price Action Strategy
